 https://www.digideo.co/wp-content/uploads/2025/01/Top-trends-2025-Pinterest-Predicts-can-grow-your-business-2025-01-15-15-21-40.png
842
1663
Urszula Urban
https://www.digideo.co/wp-content/uploads/2023/06/digideo2019-340-1.jpg
Urszula Urban2025-02-28 17:55:512025-02-28 18:00:41Top Trends in ecommerce 2025
https://www.digideo.co/wp-content/uploads/2025/01/Top-trends-2025-Pinterest-Predicts-can-grow-your-business-2025-01-15-15-21-40.png
842
1663
Urszula Urban
https://www.digideo.co/wp-content/uploads/2023/06/digideo2019-340-1.jpg
Urszula Urban2025-02-28 17:55:512025-02-28 18:00:41Top Trends in ecommerce 2025I was asked many times to present the most crucial metrics for eCommerce Industry.
Finally I prepared a list of 15 most important metrics with their condensed description and some statistical data that can be useful for your business.
By tracking your metrics, you will dramatically improve your business results.
This is the typical ecommerce funnel
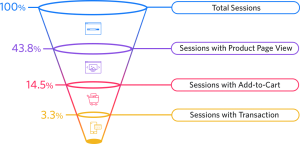
Source. Ecommerce funnels from smartinsights.com
“Typical” means average – you can always improve your metrics and business results to be in the top ten.
1. Website Traffic
What is this ecommerce metric?
This metric helps to eCommerce companies understand the popularity of a website, landing page, or separate sections within a site.
Average Website Traffic: This varies depending on the age and size of the site, as well as the product mix. For example, Statistica shows that eCommerce giant Amazon averages over 2.01 billion combined desktop and mobile visits in February 2020, down from 2.73 billion visits in December 2019 (70% of eCommerce in USA), but niche eCommerce sites see far less traffic, which varies dramatically by season.
Why is this metric important?
Increasing website traffic is often a goal for eCommerce websites. Traffic not only leads to purchases, but also a general awareness of your brand. The more people who visit, the more likely they are to remember your name, mention you to friends, or come back when they want to purchase something that you offer.
2. Conversion Rate
What is this metric?
The conversion rate is the percentage of users who take a desired action. For e-commerce, one of the most important conversion rates is the percentage of website visitors who buy something on the site.
In Google Analytics, which can be considered the standard reference, sales transactions are divided by visits. E-commerce Conversion Rate is defined by Google as:
“The ratio of transactions to sessions, expressed as a percentage. For example, a ratio of one transaction to every ten sessions would be expressed as an Ecommerce Conversion Rate of 10%”.

Average Conversion Rate
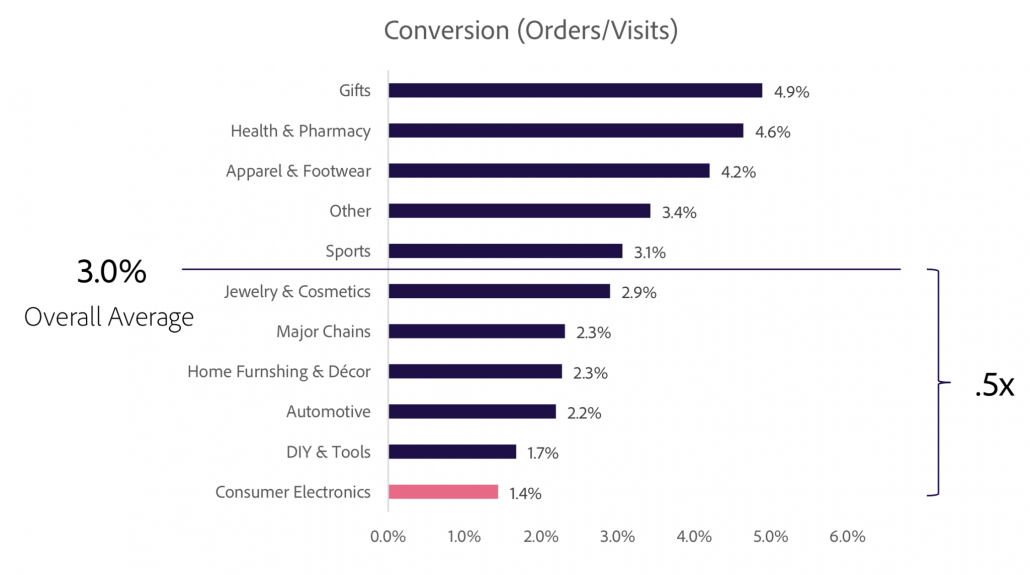
According to Adobe Digital Index 2020 report into consumer electronics, the average retail conversion rate stood at 3% in 2019. However, these rates vary by the devices used. Conversion rates are highest for “Traditional” (desktop) and lowest for mobile but in some categories it is almost 50/50.
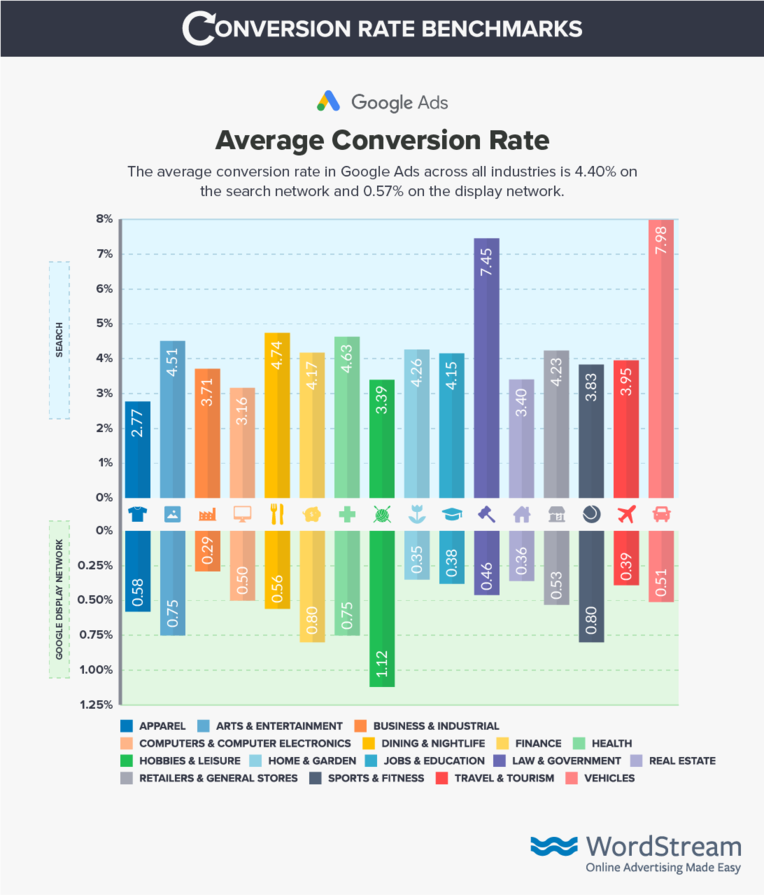
Google Ads conversion rate
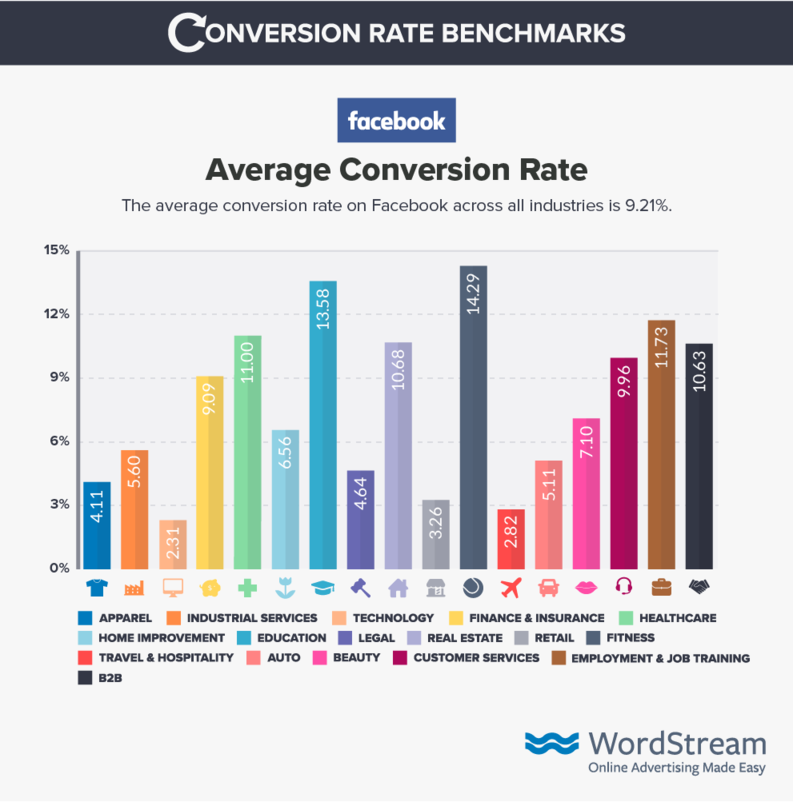
Facebook Ads conversion rate
Google Shopping conversion rate
The average conversion rate across Google Shopping was only 1.91%.
The desktop vs smartphone conversion rates comparison:
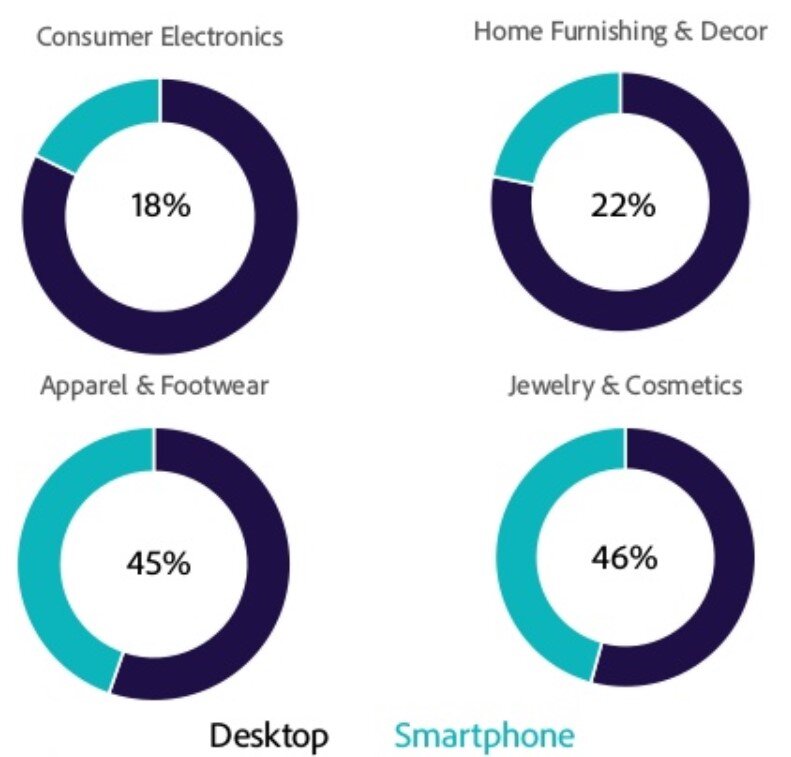
Why is this metric important?
The conversion rate measures what happens once people are at your website. This metric is greatly impacted by the site’s design and user-friendliness. No other metric so holistically captures as many critical aspects of a web site – user design, usability, performance, convenience, ad effectiveness, net promoter score, customer satisfaction – all in a single measurement. You can check what devices people use and adjust your ecommerce site to their preferences.
It looks like more people prefer desktop but in some categories like personal stuff, jewelry, toys, clothes, shoes – smartphones start to win.
3. Time To Purchase
What is this ecommerce metric?
This metric tells you approximately how long it took for visitors to your site to change into actual customers. While some people may visit your site and immediately make a purchase, others may visit two, three, or even more than ten times before they decide to buy from you.

Average Time to Purchase
According to Nielsen Norman Group, half of all online purchases occur within 28 minutes of the initial click. 75% occur within 24 hours, 90% by day 12, and the remainder occur more than 4 weeks after the initial click.
Why is this ecommerce metric important?
Knowing your average time to purchase can help you make really smart decisions about your marketing. For example, you may want to set up a special email marketing campaign for a computer equipment store that sends detailed information to shoppers based on what they were looking at. On the other hands, general sale or new product emails will work well for stores with lots of impulse shoppers.
4. Average Transaction Value
What is this metric?
The Average Transaction Value (ATV) is the average dollar amount that a consumer spends with you, within a single transaction.
Average Transaction Value
According to RJMetrics and Monetate top performing e-commerce companies have an average transaction value of $107 for USA and ca. $71 for UK. For all other e-commerce companies, this value is $75.
Why is this ecommerce metric important?
The ATV is very important when evaluating the total success of a business. Attracting customers is no easy feat, and it costs money to secure each customer’s business. If you can increase your ATV with each customer, you will end up with a higher return on investment (ROI) on your sales and marketing costs.
5. Add to Cart Rate
What is this ecommerce metric?
The Add to cart rate is the ratio of customers who added the product to the cart to the overall number of visitors.
According to Monetate Add to Cart rate was 15,98% globally ( 10% in USA, 15% in GB) in 2019. It is a good indicator to check if your offer is really interesting and it is related to the Abandoned Cart rate.

6. Cost Per Conversion
What is this ecommerce metric?
Cost Per Conversion (CPC) is the amount you essentially pay to turn a visitor into a buyer.
Average Cost per Conversion
A recent study published by MarketingSherpa shows that overall the cost of ecommerce customer acquisition is rising. The same study found that ecommerce companies fall into three main categories of acquisition cost, each with a different average cost.
The average cost per conversion across Google Ads is $56.11 on the search network and $90.80 on the display network by Wordstream.
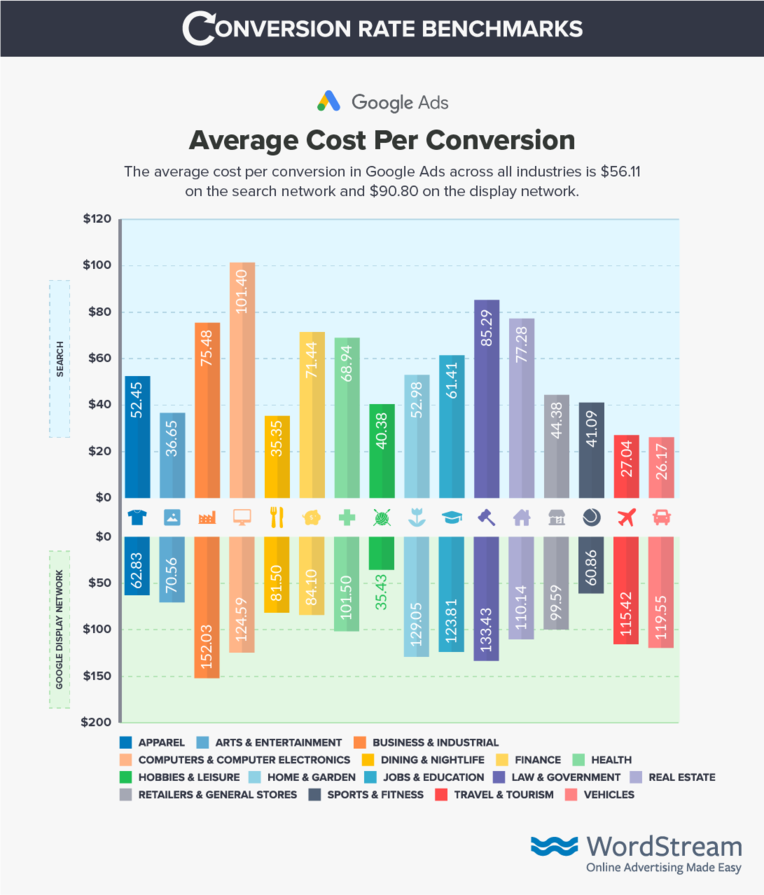
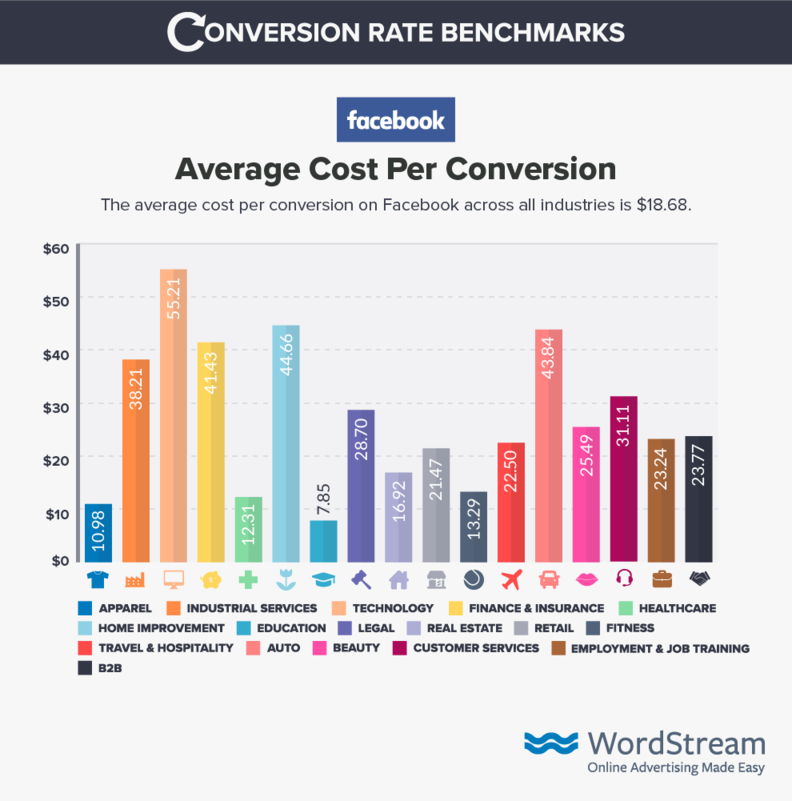
Facebook Ads Cost per conversion
The average cost per conversion across Facebook Ads was $18.68 in 2019
Why is this metric important?
Knowing what your CPC averages is extremely important. It helps you determine the true return on investment. In the end, if a campaign brings you only clicks but no orders, it’s not successful. It can help you make smarter decisions about how much your products should be sold for, what you should pay for advertising, and even how you should market your business online.
7. Traffic Sources
What is this metric?
The Traffic Sources Metric provides an indication of who a site’s visitors are, and where they’re visiting from. Traffic sources metrics consists of the following data:
- Direct Traffic: all those people showing up to your Web site by typing in the URL of your Web site or from a bookmark. Some people also call this “default traffic” or “ambient traffic.”
- Referring URLs: other Web sites sending traffic to you. These could be as a result of your banner ads or campaigns. These could be all those blogs or affiliates who link to you.
- Search Engines: Google, Yahoo, MSN, Ask, others. This bucket will include both your organic as well as your paid (PPC/SEM) traffic, so be aware of that.
- Other: These include campaigns you have run, e-mail, direct marketing and so on.
Why is this metric important for ecommerce?
Knowing where a site’s traffic comes from can help ecommerce companies understand how well marketing campaigns are working and how better to invest in site content, advertising, or other forms of engagement.
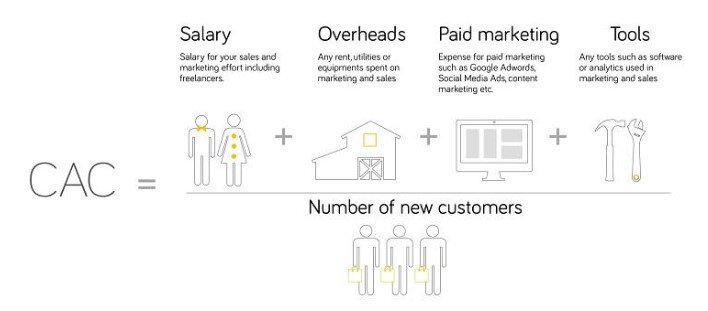
In fact, according to Jake Mastrandrea, growth marketer at Adobe, marketers should tap into channels where the customer lifetime value is at least three times the cost of acquisition (CAC).
8. Average Number of Pages Visited
What is this metric?
Pages per visit is a measure of how many pieces of content (Web pages) a particular user or group of users views on a single website. Pages per visit is usually displayed as an average, which is calculated by dividing the total number of page views by the total number of visitors. It can be further broken down by country, region and even demographic in complex Web analytics programs.
Average Number of Pages Visited
Over the span of a year, Wolfgang Digital found that an average of 5.4 pages are visited per session.
Why is this metric important?
Pages per visit is a broad measure of how compelling users find the content on a website and how well it is arranged for navigation. It will tell you if your shop’s content is engaging and if your traffic is targeted. If these stats are low, you might want to reconsider the focus keywords and ad campaigns that may be bringing in unqualified traffic.
9. Average Time Spent on Site
What is this metric?
This metric measures the time spent on the website during one session.
Average Time Spent on Site
Wolfgang Digital studied average session lengths for a full year. The company found that the average session lasts 3.49 minutes. Wolfgang Digital studied average session lengths for a full year. The company found that the average session lasts 3.49 minutes. Per our experience and research reasonable benchmark for average session duration is between 2-3 minutes.
Use these nine tips to give your site’s average session duration a boost:
- Include Videos
- Break Up Text With Engaging Images
- Understand the Customer Journey
- Track the Right Metrics
- Make Sure Your Interface Is User-Friendly
- Format Your Content so it’s Easy to Read
- Link to Other Pages of Your Site
- Build a Library
- Publish Content That’s Worth Reading
Why is this eCommerce metric important?
Looking at the average time users spend on the entire website will give you a holistic view of how your website is performing..
10. Shopping Cart Abandonment
What is this ecommerce metric?
This metric shows the percentage of people who start the checkout process but do not complete it. They added products but they resigned or your shopping cart doesn’t work properly.
Average Shopping Cart Abandonment Rate
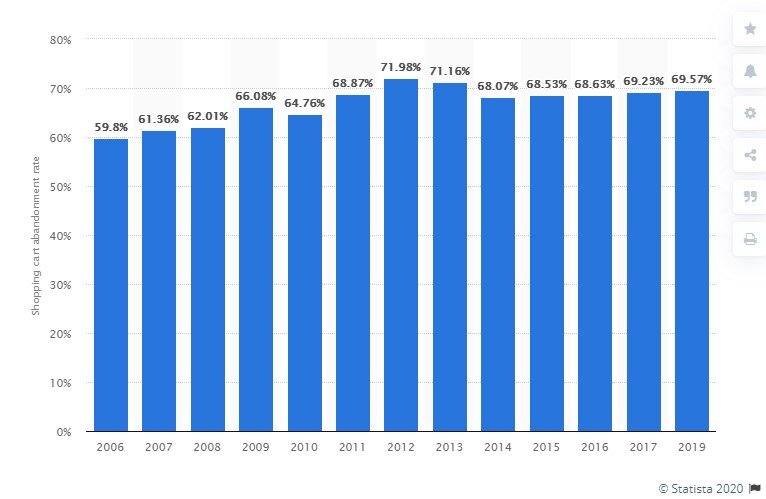
It’s 2020, and cart abandonment is still a big problem for ecommerce sites. Actually, the average global shopping cart abandonment rate for online ecommerce is 69.57% (according to 2019 data). It is one of the most important eCommerce metrics which should be tracked on regular basis. You can improve it by introducing the marketing automation and automated follow up emails.
Why is this ecommerce metric important?
The rate at which visitors abandon is an important statistic to track for online retailers as it can mean the difference between a profitable eCommerce store and unsuccessful one. Any changes to influence the abandonment rate will have a direct, measurable impact on the bottom line.
Making sure shoppers complete the final stage of the transaction is a crucial part of improving your conversion rate, and ultimately your bottom line.
There can be many reasons why customers abandon their cart, some within, and others outside of your control.
Some of the factors which you can influence are:
- Unexpected or high shipping costs (address this by eliminating hidden costs)
- requiring purchasers to sign up or register
- Check out process too complicated or seen to be insecure
- Slow estimated delivery time
- Limited payment options
11. Average Bounce Rate
What is this metric?
The Bounce rate is the rate at which new visitors visit a site and immediately click away without doing anything (very low time spent and no interactions).
Average Bounce Rate
Monetate reports the desktop shopper bounce rate at 35.25% in Q1 2015. For tablet shoppers, the rate was 29.6%, and for mobile shoppers 39.3%.
Why is this ecommerce metric important?
A high bounce rate can mean several things, including weak or irrelevant sources of traffic and landing pages that aren’t optimized for conversion (have a poor design, low usability or high load times). Bounce rates for e-commerce sites are often called abandonment rates, i.e., the rate at which people abandon their shopping cart without making a purchase. This is usually a result of an overly complicated checkout process, expired deals, forced cart additions (e.g. to see the actual price of the product, add to your cart), and so on.
12. Repeat Visitor Ratio / Customer Retention Rate / Visitor Loyalty
What is this metric?
The Customer Retention Rate is the proportion of customers who return to you for repeat business.
Average Repeat Visitor Ratio
According to Sweet Tooth, the average ecommerce store generates 43% of its revenue from repeat purchases. At best-in-class companies, that number nears 80%.
Why is this metric important?
Acquiring new customers is increasingly expensive. Getting existing customers to purchase again is cheap — costing between ⅓ and ⅛ as much. Companies that excel at turning one-time buyers into repeat purchasers have more profitable, sustainable businesses, with higher lifetime values.
To be successful in customer retention, it is critical to build strong relationships with your customers, and therefore make sure they keep coming back. Offering excellent customer service is one way to do this, as well as using techniques like a regular newsletter and offline events to build up a strong, loyal customer base
13. Average Order Value
What is this ecommerce metric?
The average order value is the amount or value of your average sale. It is one of the most important eCommerce metrics you should track. We use it for sales forecasts and setting rules for discounts and other promotions. Many merchants use it for the shipping cost calculation.
List of Ecommerce Average Order Value Benchmarks
British Pounds
- GPB 86.98 ($100): IRP Commerce (Q1 2019)
- GPB 91.37 ($116) IRP Commerce (November 2018)
US Dollars
- $133.77: Monetate Ecommerce Quarterly (Q3 2018)
- $132.62: Monetate Ecommerce Quarterly (2018)
- $119.02 Salesforce Commerce Cloud (2018)
- $82.00: Comscore (2017)
- $115.38 DEMAC Media (2016)
- $72.00: RJMetrics (2015)
EUROs
- EUR 282 ($250): Wolfgang Digital KPI Report (2019)
- EUR 139 ($158): Wolfgang Digital (2017)
Why is this metric important?
Increasing average order values is important as it means higher revenue and better ROI. It also positively impacts other metrics such as average acquisition cost and customer lifetime value.
There are many strategies you can use to increase the value of your customers’ orders, including:
- up-selling your customers to more expensive purchases,
- bundling products together (a slightly more complex version of the traditional buy 2 get 1 free sales technique),
- recommending additional products they may like based on their purchase, and
- offering add-ons or premium versions of your products
14. Email Opt-Ins
What is this metric?
Email Opt-ins rate is the portion of visitors who visited your website and registered to your newsletter, to your total number of visitors in the particular period of time.
Email Opt-ins rate
The average email opt-in rate is 1.95%. Anything above that and you’re doing better than half the world ( source: Sumo)
Why is this metric important?
Having customers opt-in to your mailing list is incredibly useful to drive marketing and secure repeat sales. Email lists are a great way for you to drive traffic to your site under your control, as well as being one of the most cost-effective marketing techniques.
However, an email list is only as strong as the number of email addresses it contains, therefore it is important to have as many opt-ins as possible, whether from sales or even visitors who do not buy anything.
Depending on the email marketing tool you are using, you may be able to track opt-ins (and, importantly, where they came from) through the platform’s built-in analytics. Google Analytics can also track opt-ins from your Order Confirmation page.
15. Net Promoters Score
What is this metric?
Net Promoters Score NPS is a metric used to measure customer satisfaction.
Why is this metric important?
Calculate your NPS using the answer to a key question, using a 0-10 scale: How likely is it that you would recommend [brand] to a friend or colleague?
Respondents are grouped as follows:
- Promoters (score 9-10) are loyal enthusiasts who will keep buying and refer others, fueling growth.
- Passives (score 7-8) are satisfied but unenthusiastic customers who are vulnerable to competitive offerings.
- Detractors (score 0-6) are unhappy customers who can damage your brand and impede growth through negative word-of-mouth.
Subtracting the percentage of Detractors from the percentage of Promoters yields the Net Promoter Score, which can range from a low of -100 (if every customer is a Detractor) to a high of 100 (if every customer is a Promoter).

Net Promoter scores can be tracked manually be conducting your own customer surveys, for example via email, or through tools like Customer.guru or Promoter.io.
Summary
Essentially there are three ways to grow a business: increase your customer base, increase the average order size or increase the number of repeat purchases.
The metrics and important marketing KPIs for eCommerce that I added here, will help you grow your eCommerce business, address any weaknesses, and ensure better ROI .
| Global Ecommerce KPIs (averages) | In 2022 (latest) |
| Average Conversion Rate (purchase) | 1.72% |
| Average Order Value (AOV in USD) | $116.72 |
| Add-to-Cart Rate | 7.00% |
| Cart Abandonment Rate | 71.98% |
| Purchase Return Rate | 16.50% |
| Purchase Session Length | 15m 5s |
| Retail Ecommerce Margin | 7.00% |
| Retail Ecommerce Pre-Tax Profit Margin | 1.30% |
| Cost Per Sales from Marketing Cost (CPA%) | 8.80% |
Our posts
 https://www.digideo.co/wp-content/uploads/2025/01/Top-trends-2025-Pinterest-Predicts-can-grow-your-business-2025-01-15-15-21-40.png
842
1663
Urszula Urban
https://www.digideo.co/wp-content/uploads/2023/06/digideo2019-340-1.jpg
Urszula Urban2025-02-28 17:55:512025-02-28 18:00:41Top Trends in ecommerce 2025
 Digideo
What are the latest AI tools that can enhance ecommerce strategies
AI, business tools, e-commerce, strategy
The Future of E-commerce Platforms: What to Expect in the Next 5 Years
consulting, e-commerce, strategy Digideo
https://www.digideo.co/wp-content/uploads/2024/12/Integrating-Magento-with-Popular-CRMs.png
1080
1080
Urszula Urban
https://www.digideo.co/wp-content/uploads/2023/06/digideo2019-340-1.jpg
Urszula Urban2024-12-10 19:46:302025-01-27 13:01:03Integrating Magento with Popular CRMs: A Step-by-Step Guide
 Digideo
https://www.digideo.co/wp-content/uploads/2024/11/5-Fraud-Detection-AI-apps-Instagram-Post.png
1080
1080
Urszula Urban
https://www.digideo.co/wp-content/uploads/2023/06/digideo2019-340-1.jpg
Urszula Urban2024-11-13 17:09:492024-11-20 15:47:475 Fraud Detection AI Apps for E-commerce
 Digideo
Turn prospects into profit
AI, consulting, consumer behaviour, CRM, marketing, marketing automation, SEM, social marketing https://www.digideo.co/wp-content/uploads/2024/10/Magento-2-One-Step-Checkout-1.png
1080
1080
Urszula Urban
https://www.digideo.co/wp-content/uploads/2023/06/digideo2019-340-1.jpg
Urszula Urban2024-10-21 17:28:562025-02-28 16:08:07Checkout Plugin in Magento 2 with Aheadworks
 Digideo
https://www.digideo.co/wp-content/uploads/2024/09/Magento-vs-Shopify-vs-WooCommerce.png
1080
1080
Urszula Urban
https://www.digideo.co/wp-content/uploads/2023/06/digideo2019-340-1.jpg
Urszula Urban2024-10-16 14:49:572024-10-21 16:08:57Magento vs Shopify vs WooCommerce: Which Platform is Right for Your Business?
 Digideo
Enhancing eCommerce strategies through AI tools
AI, business tools, CRM, e-commerce, marketing automation, security, strategy Digideo
https://www.digideo.co/wp-content/uploads/2024/10/Customer-journey-mapping-in-Zoho-CRM.png
1080
1080
Urszula Urban
https://www.digideo.co/wp-content/uploads/2023/06/digideo2019-340-1.jpg
Urszula Urban2024-10-01 17:43:472024-10-30 11:01:32Customer journey mapping in Zoho CRM
Streamline Your Payment Processes with Zoho Checkout: A Comprehensive Review
business tools, e-commerce Digideo
What factors contribute to a good user experience in an online shop
consumer behaviour, e-commerce, SEO, usability, UX/UI design Digideo
https://www.digideo.co/wp-content/uploads/2024/07/Usability-testing-is-really-important.png
945
1680
Urszula Urban
https://www.digideo.co/wp-content/uploads/2023/06/digideo2019-340-1.jpg
Urszula Urban2024-07-07 12:02:482024-10-08 15:34:18Usability Testing is important
 Digideo
https://www.digideo.co/wp-content/uploads/2024/06/E-mail-marketing-checklist-banner-new.png
788
1400
Urszula Urban
https://www.digideo.co/wp-content/uploads/2023/06/digideo2019-340-1.jpg
Urszula Urban2024-06-08 20:08:522024-11-05 19:30:41Email marketing checklist
 https://www.digideo.co/wp-content/uploads/2023/06/CRM-Automation-Solutions-Enhancing-Customer-Relationships-and-Sales.png
371
517
Urszula Urban
https://www.digideo.co/wp-content/uploads/2023/06/digideo2019-340-1.jpg
Urszula Urban2024-06-02 12:22:472024-10-08 16:53:38CRM Automation Solutions: Enhancing Customer Relationships and Sales
Share this entry